Refer to the figure shown. 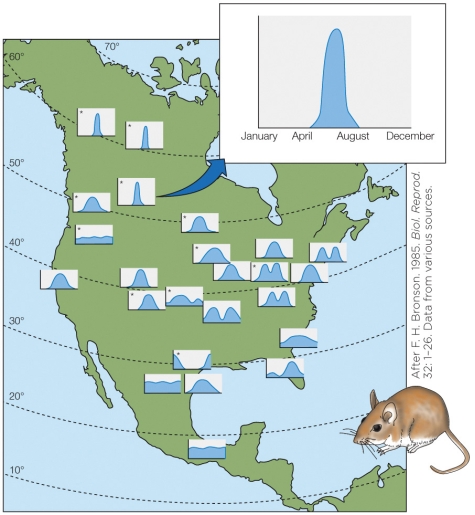 The graphs in the figure represent the
A) number of offspring produced in a given season.
B) number of copulating animals in a given season.
C) percentage of the population capable of reproducing.
D) percentage of pregnant females as a function of the season.
Correct Answer:
Verified
Q3: Which is the correct order of events
Q4: When studying the control of the annual
Q5: Which aspect of reproduction is not typically
Q6: In temperate climates, temperature often _ photoperiod
Q7: How can global warming desynchronize 2 species
Unlock this Answer For Free Now!
View this answer and more for free by performing one of the following actions

Scan the QR code to install the App and get 2 free unlocks

Unlock quizzes for free by uploading documents