Refer to the figure shown. Fish were housed under three different temperature conditions. Their response to acute and chronic temperature changes is plotted on the figure.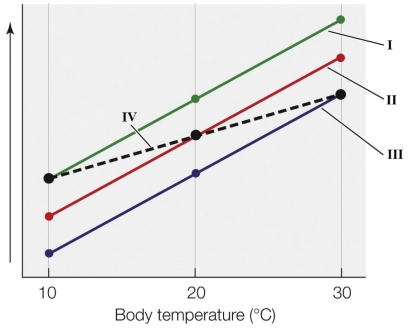 What is the property most likely to be plotted on the y axis?
A) Rate of oxygen consumption
B) Mass-specific metabolic rate
C) Metabolic rate on a log scale
D) Ventilation rate
Correct Answer:
Verified
Q28: Based on how the metabolic rates of
Q29: Suppose an animal has a metabolic rate
Q30: Suppose an animal has a metabolic rate
Q31: Most commonly, the slope of the line
Q32: Compensation is acclimation via
A) behavioral changes.
B) metabolic
Q34: Refer to the figure shown. Fish were
Q35: Refer to the figure shown. Fish were
Q36: Refer to the figure shown. Fish were
Q37: Performance curves
A) should always be calculated acutely.
B)
Q38: In aquatic poikilotherms, the most likely reason
Unlock this Answer For Free Now!
View this answer and more for free by performing one of the following actions

Scan the QR code to install the App and get 2 free unlocks

Unlock quizzes for free by uploading documents