Refer to the graphs shown.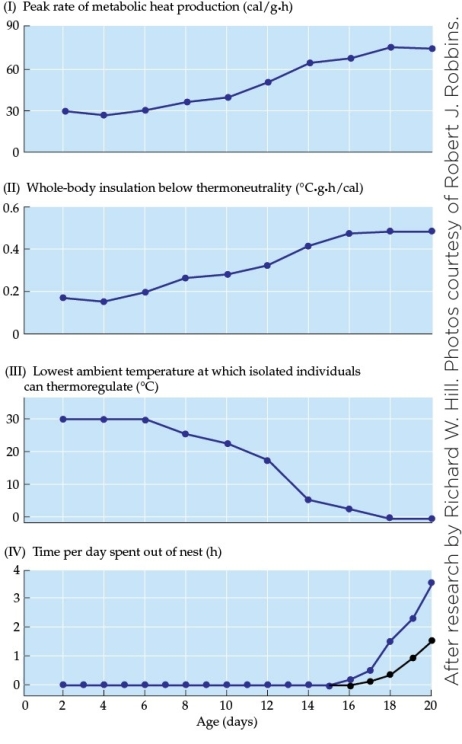 What contributes most significantly to the data shown in figure II?
A) An increase in brown fat
B) An increase in the adipose layer under the skin
C) An increase in the thickness of the epidermis
D) The development of fur
Correct Answer:
Verified
Q14: A 5-year-old human child typically devotes 50%
Q15: Indigo buntings are able to determine which
Q16: The physiological regulation of body temperature is
Q17: In terms of homeothermy, newborn mammals _
Q18: Refer to the graphs shown. Q20: Refer to the graphs shown. Q21: Refer to the graphs shown. Q22: Refer to the figure shown. Q23: Refer to the figure shown. Q24: In an 8-day-old killifish, the major site Unlock this Answer For Free Now! View this answer and more for free by performing one of the following actions Scan the QR code to install the App and get 2 free unlocks Unlock quizzes for free by uploading documents![]()
![]()
![]()
![]()
![]()

