Refer to the figure shown.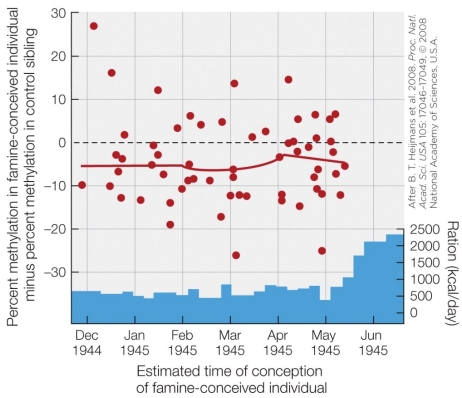 The data in the figure show that DNA methylation
A) correlates with caloric intake.
B) does not change during a famine.
C) of individuals conceived during a famine was lower than that of siblings conceived during no famine.
D) of individuals conceived during a famine was higher than that of siblings conceived during no famine.
Correct Answer:
Verified
Q43: Refer to the figure shown. Q44: Which mechanism is not used for epigenetic Q45: Which process describes a mechanism whereby environmental Q46: If DNA methylation is blocked early in Unlock this Answer For Free Now! View this answer and more for free by performing one of the following actions Scan the QR code to install the App and get 2 free unlocks Unlock quizzes for free by uploading documents![]()

