Multiple Choice
Refer to the figure shown.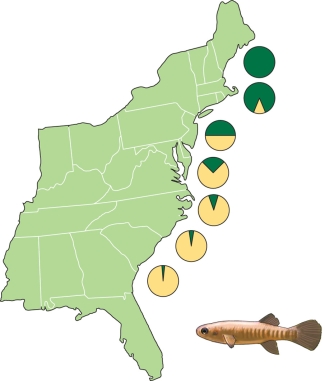 The figure shows the
A) frequency distribution of two predators on killifish.
B) frequency distribution of two different alleles of the gene for LDH.
C) frequency distribution of two main diets of killifish.
D) temperature tolerance of two subtypes of killifish.
Correct Answer:
Verified
Related Questions
Q36: Refer to the figure shown. Q37: Refer to the figure shown. Q38: A protein kinase catalyzes the phosphorylation of Q39: The _ is(are) directly responsible for the![]()
![]()

