Refer to the figure shown.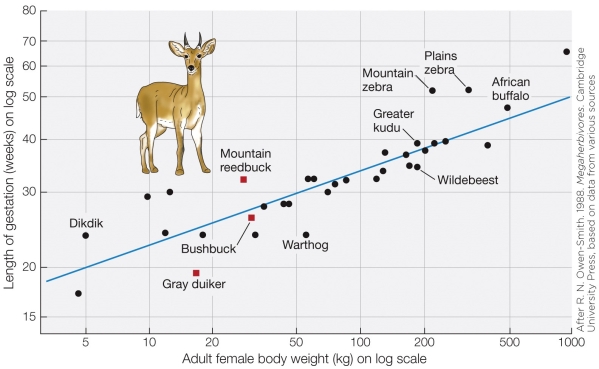 What statistical method was used to draw the trend line in the figure?
A) Phylogenetically independent contrasts
B) Ordinary least squares regression
C) Weight-specific mean
D) Logarithmic scaling
Correct Answer:
Verified
Q27: Refer to the figure shown. Q28: Which response is the longest lasting? Q29: Which statement regarding the Antarctic fish species Q30: Rainbow trout captured and brought into a Q31: During childbirth, muscular contractions acting to expel Q33: Refer to the figure shown. Q34: Refer to the figure shown. Q35: _ can tolerate a body temperature of Q36: Refer to the figure shown. Q37: Refer to the figure shown. Unlock this Answer For Free Now! View this answer and more for free by performing one of the following actions Scan the QR code to install the App and get 2 free unlocks Unlock quizzes for free by uploading documents![]()
A) Acute![]()
![]()
![]()
![]()

