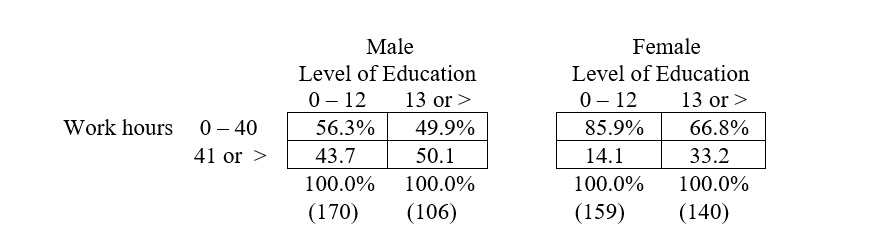
The following tables show the relationship, for employed respondents, between hours per week the respondent usually works (Work hours), level of education (number of years completed), and sex for the 2016 GSS.
 a. Which variable is controlled in each partial table?
b. Describe the relationship in each partial table.
c. The first partial (for males) has a chi-square value of 1.07, with p > .10; the second table (for females) has a chi-square value of 15.5, with p < .001. What do these statistics reveal about the relationships between the variables?
d. The zero-order association between level of education and usual hours worked per week was statistically significant. Comparing this result with the results of the partial tables, what type of elaboration outcome is shown?
Correct Answer:
Verified
Q42: R2 is a popular measure of how
Q43: Multiple regression is limited to the analysis
Q44: A dummy variable is a dichotomous variable
Q45: To determine which independent variable has the
Q46: Path analysis provides quantitative estimates of both
Q47: Draw an arrow diagram representing a causal
Q48: Explain the differences between the ideal elaboration
Q49: Explain the difference between the regression coefficient
Q51: What predicts the amount of time that
Q52: Someone at your college conducts a survey
Unlock this Answer For Free Now!
View this answer and more for free by performing one of the following actions

Scan the QR code to install the App and get 2 free unlocks

Unlock quizzes for free by uploading documents