The 1994 GSS asked the following question: Do you sometimes drink more than you think you should? The table below breaks down responses to this question by sex.
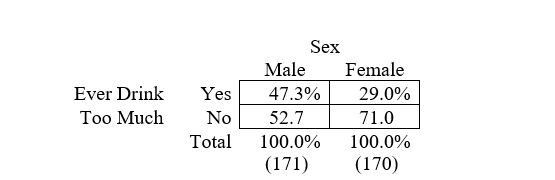 a. What is the percentage difference for determining the association between these variables?
b. Who is more likely to say that they sometimes drink more than they think they should?
c. Chi-square for this table is 12.50, which is significant at p < .001. What does this indicate about the relationship between the variables?
d. The value of phi for this table is .19. What does this statistic tell us about the relationship?
Correct Answer:
Verified
Q62: The chi-square statistic indicates whether a relationship
Q63: Direction is a statistical property that describes
Q64: Linear regression analysis should be used only
Q65: Regression coefficients indicate, among other things, the
Q66: The correlation coefficient measures the direction and
Q67: A dummy variable has only two coding
Q68: The quality of data is affected at
Q69: Describe the differences in the univariate analysis
Q70: Describe the differences in the bivariate analysis
Q72: For the 2012 GSS, the regression of
Unlock this Answer For Free Now!
View this answer and more for free by performing one of the following actions

Scan the QR code to install the App and get 2 free unlocks

Unlock quizzes for free by uploading documents