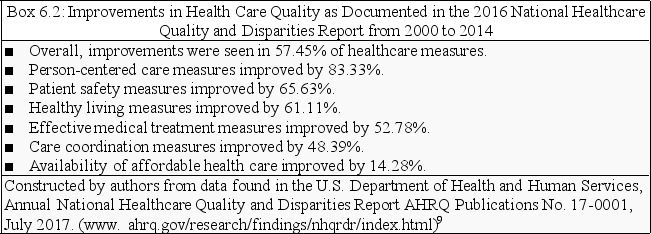
Box 6.2 provides data on quality improvements in general from 2000 to 2014. Analyze the data using the percentage difference computations you learned in Chapter 5 in order to answer questions 8 - 10.
-If you were about to have surgery which of the improvements listed would probability give you the greatest comfort?
A) The 83.33% improvement in patient-centered care
B) The 65.63% improvement in patient safety measures
C) The 48.39% improvement in care coordination
D) The 14.28% improvement in the availability of affordable health care
Correct Answer:
Verified
Q5: What is the causal pathway by which
Q6: Review the data in Box 6.1. below.
Q7: According to the text, Americans in general
Q8: Box 6.2 provides data on quality improvements
Q9: Box 6.2 provides data on quality improvements
Q11: Use Box 6.3. for these questions.
Q12: Use Box 6.3. for these questions.
Q13: 13. For this question refer to Box
Q14: According to the authors, health care administrators,
Q15: When the results of the 2000-2014 health
Unlock this Answer For Free Now!
View this answer and more for free by performing one of the following actions

Scan the QR code to install the App and get 2 free unlocks

Unlock quizzes for free by uploading documents