Each dot on the following scatterplot indicates: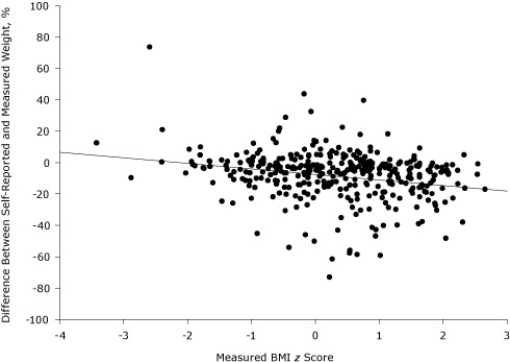
A) the subjects measured BMI (z scor
B) the relationship between caloric intake and self-reported BMI
C) the difference between self-reported and actual BMI Z score
D) the subject's z score
E) and the difference in the subjects measured BMI and self-reported BMI
Correct Answer:
Verified
Q8: Your hospital had 317 reports of patients
Q9: Which state has the largest percentage
Q10: Use the following graph.
Q11: The following is an example of what
Q12: The following table is an example of
Q14: Use the following table to determine which
Q15: The following table presents the number
Q16: The study you are reading reports that
Q17: Q18: ![]()
![]()
Unlock this Answer For Free Now!
View this answer and more for free by performing one of the following actions

Scan the QR code to install the App and get 2 free unlocks

Unlock quizzes for free by uploading documents