Refer to the figure.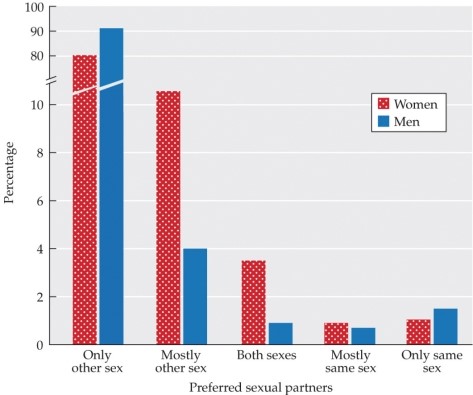 This figure shows the direction of sexual attraction for U.S. women (left-side bars) and men (right-side bars) between the ages of 18 and 44. What conclusion can you draw from these data?
A) Younger people are more likely to be honest about same-sex attraction.
B) Women appear to be slightly more flexible than men in their preferred sexual partners.
C) Men appear to be slightly more flexible than women in their preferred sexual partners.
D) About eight percent of people are mostly or entirely attracted to people of the same sex.
E) There is little evidence for the existence of bisexuality.
Correct Answer:
Verified
Q1: According to most surveys of sexual attraction,
Q3: Based on statistics, which young child is
Q4: What did Richard Green's study of feminine
Q5: Many gay men are gender-atypical in some
Q6: Alecia tells you that her gaydar is
Q7: _ believed that all children go through
Q8: Which statement most accurately reflects Sigmund Freud's
Q9: Which example accurately demonstrates the impact of
Q10: Which statement best explains the relationship between
Q11: Two studies comparing the size of INAH3
Unlock this Answer For Free Now!
View this answer and more for free by performing one of the following actions

Scan the QR code to install the App and get 2 free unlocks

Unlock quizzes for free by uploading documents