Refer to the figure.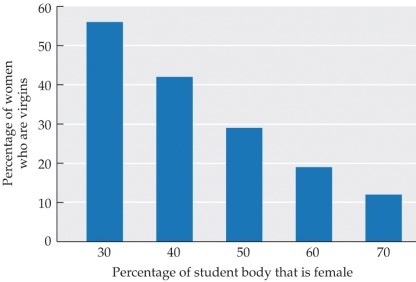 The data in the graph show that, for the colleges included in the survey,
A) college-age males prefer females who are virgins to those who are not.
B) college-age females prefer committed relationships more than college-age males do.
C) colleges with a lower percentage of male students have fewer female virgins.
D) colleges with a higher percentage of female students have more male virgins.
E) colleges with fewer female students than male students reported fewer hookups.
Correct Answer:
Verified
Q7: According to data from the General Social
Q8: Which statement best describes hooking up on
Q9: In the study by Clark and Hatfield,
Q10: When first-year college women were interviewed about
Q11: According to research cited in the textbook,
Q13: According to the textbook, some heteroflexible young
Q14: Which person could be described as high
Q15: According to the NHSLS study, which group
Q16: An anthropologist is documenting the rituals individuals
Q17: Marco wants to express his interest in
Unlock this Answer For Free Now!
View this answer and more for free by performing one of the following actions

Scan the QR code to install the App and get 2 free unlocks

Unlock quizzes for free by uploading documents