Refer to the figure.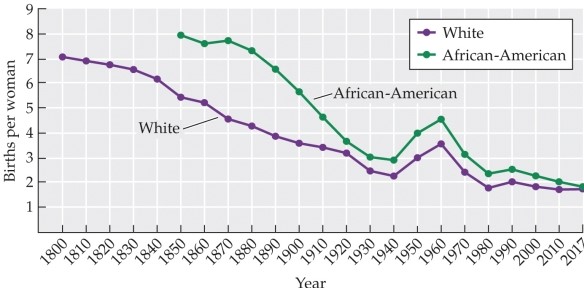 This graph shows births per woman by year for white and African-American women. Data for African-American women are shown with the green (top) line. What conclusion can be drawn from the information in the graph?
A) A decline in births correlates with a decline in sexual activity.
B) Declining births are due to the availability of the birth control pill.
C) Birth rates for both white and African-American women have declined since 1850.
D) Since 1850, births have declined for white women but not for African-American women.
E) Changes in the institution of marriage have caused a decline in the birth rate.
Correct Answer:
Verified
Q10: For most of its history, organized Christianity
A)
Q11: In Italy, some young males used to
Q12: Historically, who was most likely to benefit
Q13: The community likely to have the highest
Q14: How have television and the internet shaped
Q16: Which statement illustrates the concept of a
Q17: According to the textbook, which is a
Q18: The sexual revolution of the 1960s resulted
Q19: What most likely limited research on sexual
Q20: A therapist believes that men develop fetishes
Unlock this Answer For Free Now!
View this answer and more for free by performing one of the following actions

Scan the QR code to install the App and get 2 free unlocks

Unlock quizzes for free by uploading documents