Multiple Choice
Refer to the figure.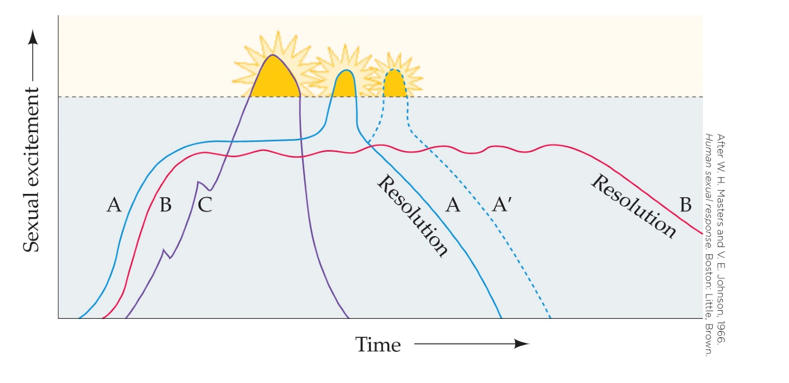 This graph most likely represents the
A) reponse of rats to exposure to pheromones.
B) timeline of sexual differentiation in early development.
C) typical sexual response pattern of human females.
D) behavior of male elephants during the mating season.
Correct Answer:
Verified
Related Questions
Q14: In male rats, the medial amygdala plays
Q15: In order for sexual behavior to occur
Q16: The hormone _ plays a role in
Unlock this Answer For Free Now!
View this answer and more for free by performing one of the following actions

Scan the QR code to install the App and get 2 free unlocks

Unlock quizzes for free by uploading documents