Refer to the figure.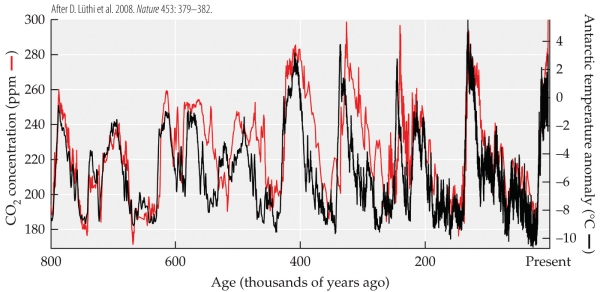 The figure shows the temperature (in °C, relative to modern temperature) and the concentrations of carbon dioxide (in ppm) and methane (in ppb) over the past 400,000 years.
-Relative to the average over the last 400,000 years, concentrations of CO2 during the warm interglacial periods in this time period have been _______, and concentrations of methane have been _______.
A) high; high
B) high; low
C) low; high
D) low; low
Correct Answer:
Verified
Q3: The concentration of atmospheric carbon dioxide in
Q4: Why is there a net flow of
Q5: Refer to the figure. Q6: Refer to the figure. Q7: Refer to the figure. Q9: Which statement about the nitrogen cycle is Q10: Which statement about the global phosphorus cycle Q11: Which statement best describes the effect of Q12: Which statement about the global sulfur cycle Q13: Refer to the figure. Unlock this Answer For Free Now! View this answer and more for free by performing one of the following actions Scan the QR code to install the App and get 2 free unlocks Unlock quizzes for free by uploading documents![]()
![]()
![]()
![]()

