Refer to the figure.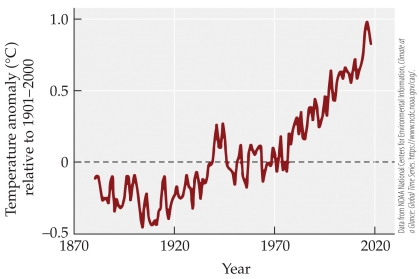 The figure shows mean annual global temperature anomalies between 1880 and 2019.
-
Between 2000 and 2019, temperatures
A) decreased 0.10°C.
B) increased 0.05°C.
C) increased 0.12°C.
D) increased 0.30°C.
Correct Answer:
Verified
Q22: Aerosols are known to have a _
Q23: Which statement about climate is false?
A) Climate
Q24: Between 1880 and 2012, the average annual
Q25: The warming of Earth in recent decades
Q26: Refer to the figure. Q28: Select the greenhouse gas that fits the Q29: A reduction in aerosols in the atmosphere Q30: Which event would lead to enhanced atmospheric Q31: Refer to the figure. Q32: Which organism would most likely encounter the![]()
![]()
Unlock this Answer For Free Now!
View this answer and more for free by performing one of the following actions

Scan the QR code to install the App and get 2 free unlocks

Unlock quizzes for free by uploading documents