Refer to the figure.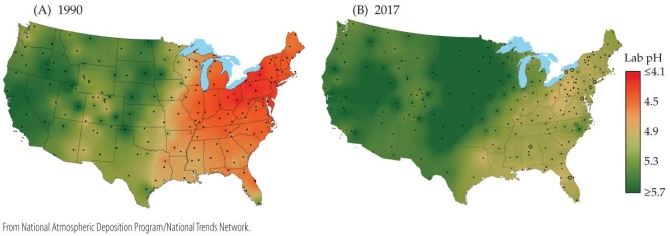 The figure shows the pH of precipitation in the United States in 1990 (left) and 2017 (right) . The acidity of precipitation during both time periods was most extreme in the _______ part of the country, and the acidity of precipitation in this area _______ between 1994 and 2004.
A) eastern; increased
B) eastern; decreased
C) western; increased
D) western; did not change
Correct Answer:
Verified
Q35: Refer to the figure. Q36: Refer to the figure. Q37: Refer to the figure. Q38: In areas such as Vermont that have Q39: Advanced stages of soil acidification lead to Q41: As nitrogen input increases, _ remains nearly Q42: In eutrophic waters, algal growth is _, Q43: Refer to the figure. Q44: Ozone in the _ is beneficial because Q45: Loss of stratospheric ozone has been most Unlock this Answer For Free Now! View this answer and more for free by performing one of the following actions Scan the QR code to install the App and get 2 free unlocks Unlock quizzes for free by uploading documents![]()
![]()
![]()
![]()

