Refer to the figure.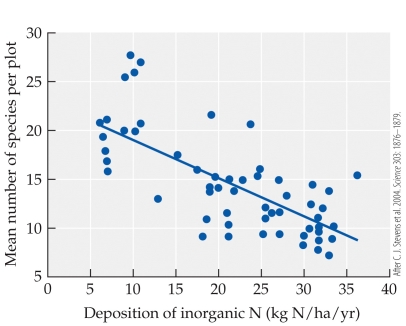 The figure shows the relationship between the mean number of species per plot and the deposition of inorganic nitrogen in kilograms per hectare per year. Within the scope of this experiment, the deposition of each kilogram per hectare of nitrogen reduced plot species diversity by about _______ species.
A) 0.3
B) 0.7
C) 1.1
D) 2.5
Correct Answer:
Verified
Q64: Select the greenhouse gas that fits the
Q65: Dust from the Gobi Desert can cross
Q66: Refer to the map. Q67: Refer to the map. Q68: During the retreat of continental glaciers in Q69: Which if the following is not a Q70: The two major compounds in the atmosphere Q71: As nitrogen input increases, _ increases at Q73: Which statement about the stratospheric ozone layer Q74: Too much ozone in the lower atmosphere![]()
![]()
Unlock this Answer For Free Now!
View this answer and more for free by performing one of the following actions

Scan the QR code to install the App and get 2 free unlocks

Unlock quizzes for free by uploading documents