Refer to the figure.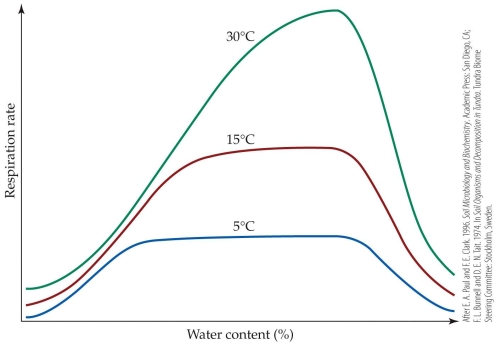
-Which statement best explains the downward trend that follows the peak of each curve?
A) Low soil moisture limits the activity of decomposers.
B) Soils with over one half of the water content indicated have concentrations of oxygen that are too low for optimal rates of decomposition.
C) Soils with extremely high water content are unable to sustain decomposition activity.
D) Soils with over one half the water content indicated increases the metabolic rate of decomposers.
Correct Answer:
Verified
Q16: The atmosphere is composed of _% nitrogen
Q17: Which statement correctly describes the role of
Q18: Which statement about nitrogen fixation is false?
A)
Q19: Earthworms contribute to decomposition by
A) breaking down
Q20: Which intervention would most likely lead to
Unlock this Answer For Free Now!
View this answer and more for free by performing one of the following actions

Scan the QR code to install the App and get 2 free unlocks

Unlock quizzes for free by uploading documents