Refer to the figure.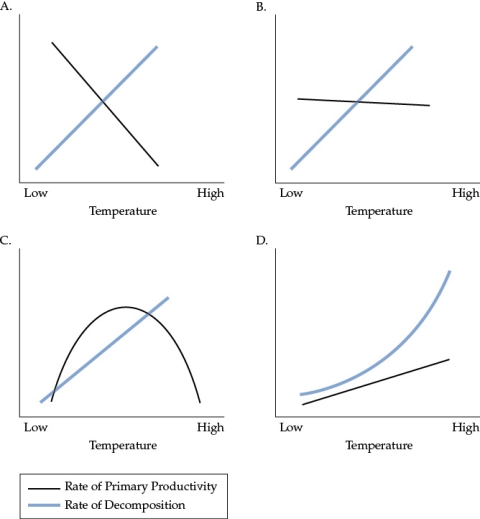 Which figure best illustrates the relationship between temperature and primary productivity and temperature and rates of decomposition?
A) Figure A
B) Figure B
C) Figure C
D) Figure D
Correct Answer:
Verified
Q32: Refer to the table. Q33: Suppose that the mean residence time of Q34: What would be the mean residence time Q35: Which ecosystems have the slowest turnover rates Q36: The residence times of nutrients in the Q38: When studying terrestrial ecosystems, ecologists commonly focus Q39: Of nitrogen and phosphorus, which is the Q40: What is the input of calcium into Q41: Soluble phosphorus combines with iron to form Q42: Refer to the figure.![]()
![]()
Unlock this Answer For Free Now!
View this answer and more for free by performing one of the following actions

Scan the QR code to install the App and get 2 free unlocks

Unlock quizzes for free by uploading documents