Refer to the figure.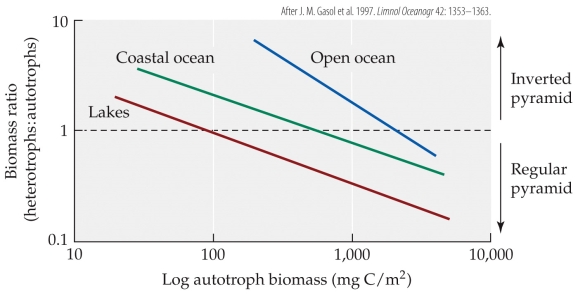 The figure shows the relationship between the total autotroph biomass in the ecosystem and the ratio of heterotrophic to autotrophic biomass for lakes, coastal ocean, and open ocean. According to the figure, at 1,000 mgC/m2 of autotrophic biomass, lakes would be predicted to have a(n) _______ biomass pyramid, coastal oceans would be predicted to have a(n) _______ biomass pyramid, and open oceans would be predicted to have a(n) _______ biomass pyramid.
A) regular; regular; regular
B) regular; regular; inverted
C) inverted; regular; regular
D) inverted; inverted; regular
Correct Answer:
Verified
Q8: A leaf from a deciduous forest that
Q9: Which statement about allochthonous inputs is false?
A)
Q10: Which statement about the second law of
Q11: Which pyramid is most likely to be
Q12: Refer to the figure. Q14: Refer to the figure. Q15: Hairston and colleagues argued that terrestrial ecosystems Unlock this Answer For Free Now! View this answer and more for free by performing one of the following actions Scan the QR code to install the App and get 2 free unlocks Unlock quizzes for free by uploading documents![]()
![]()

