Refer to the figure.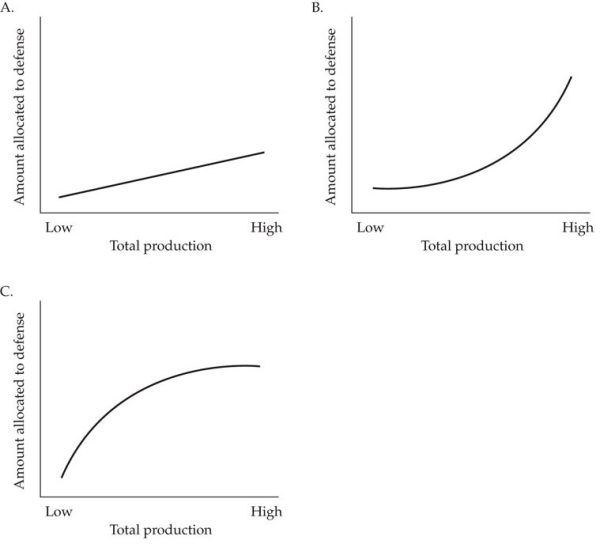 Which figure shows the most likely relationship between the total amount of production and the amount of resources allocated to defense in an ecosystem?
A) Figure A
B) Figure B
C) Figure C
D) Figure A in aquatic ecosystems; Figure B in terrestrial ecosystems
Correct Answer:
Verified
Q11: Which pyramid is most likely to be
Q12: Refer to the figure. Q13: Refer to the figure. Q14: Refer to the figure. Q15: Hairston and colleagues argued that terrestrial ecosystems Q17: Suppose the trophic efficiency between producers and Q18: Suppose the trophic efficiency between producers and Q19: If herbivores eat 320 kg of plants, Q20: If a cow with an assimilation efficiency Q21: The production efficiency of an herbivore is Unlock this Answer For Free Now! View this answer and more for free by performing one of the following actions Scan the QR code to install the App and get 2 free unlocks Unlock quizzes for free by uploading documents![]()
![]()
![]()

