Refer to the table.
Table 1
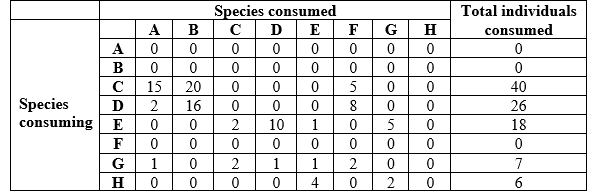 You are studying how energy flows in a food web. The data in Table 1 shows the dietary composition of species in your study area (for species A-H). To read the data table, start at a species in column 1, read to the right across that row to find the number of individuals consumed, then read straight up to determine the species that it consumed. For example, species C consumed 15 individuals of species A. Create a new table (this will be referred to as Table 2) with three columns; species, species consumed, and classification (by diet). Determine which species were consumed by each species. Then, based on this information, classify each species by its diet (e.g., herbivore, etc.). Based purely on the number of species consumed, which species was the most generalist in terms of consumption of other species? How many different species did this generalist consume?
Correct Answer:
Verified
Q47: Which statement accurately describes the portfolio effect?
A)
Q48: In the early 1970s, May criticized Elton
Q49: Higher trophic levels often have _ concentrations
Q50: The devastating effects of DDT and other
Q51: In which human communities would one be
Q53: Refer to the tables. Q54: Refer to the table. Q55: Refer to the tables. Q56: Refer to the table and figure. Q57: Refer to the figure.
![]()
Table 1

![]()
Table 3
Figure 2
Unlock this Answer For Free Now!
View this answer and more for free by performing one of the following actions

Scan the QR code to install the App and get 2 free unlocks

Unlock quizzes for free by uploading documents