Refer to the table and the figure.
Table 2
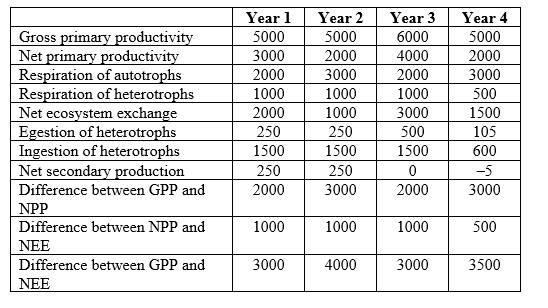 Figure 1
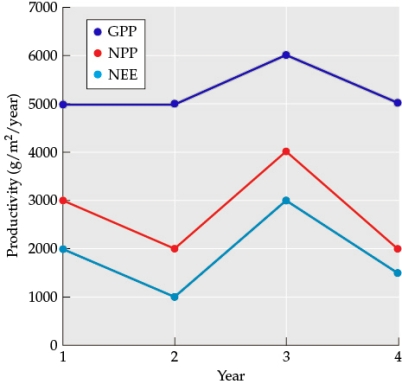
-You are studying the movement of energy through an ecosystem. You collect data on energy use at the same site across four years, measured in g/m2/year. Assume that the site is sampled at the same location on the same date each year. Compare net secondary production in year 3 with year 2. How did net secondary production change? What might have driven this change?
Correct Answer:
Verified
View Answer
Unlock this answer now
Get Access to more Verified Answers free of charge
Q48: Refer to the table.
Table 1

Q49: Refer to the table.
Table 2
Q50: Refer to the table and the figure.
Table
Q51: Refer to the table and the figure.
Table
Q52: Refer to the table and the figure.
Table
Q54: Refer to the table and the figure.
Table
Q55: Refer to the table and the figure.
Table
Q56: Refer to the table and the figure.
Table
Q57: Imagine you are investigating the possibility that
Q58: Imagine you are investigating the possibility that
Unlock this Answer For Free Now!
View this answer and more for free by performing one of the following actions

Scan the QR code to install the App and get 2 free unlocks

Unlock quizzes for free by uploading documents