Refer to the table.
Table 1
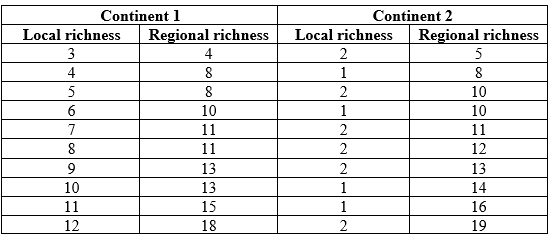 You are investigating patterns of species richness on two different continents (Continent 1 and Continent 2) to determine how species richness patterns differ between them. For multiple study sites on each of the two continents, you sample the local species richness and compare it to the species richness of the broader region to which each site belongs. The data on species richness are shown in the table. Using the data in Table 1, plot a graph of the relationship between local and regional species richness on the two continents (this will be referred to as Figure 1). Sketch a straight line that indicates the general pattern of the relationship. Add a line with a slope of 1 to the graph to indicate how the relationship between regional and local species diversity would look if regional and local species diversity were the same.
Correct Answer:
Verified
Q41: Refer to the figure. Q42: In the equilibrium model of island biogeography, Q43: Which of the following is a finding Q44: Which statement about the Biological Dynamics of Q45: Fire-tolerant plant species in the Amazon are Q47: Refer to the table and figure. Q48: Refer to the figure. Q49: Refer to the figure. Q50: Refer to the figure. Q51: Refer to the figure.![]()
Table 1
Figure 2

Figure 3
Figure 3
Figure 3
Unlock this Answer For Free Now!
View this answer and more for free by performing one of the following actions

Scan the QR code to install the App and get 2 free unlocks

Unlock quizzes for free by uploading documents