Refer to the figure.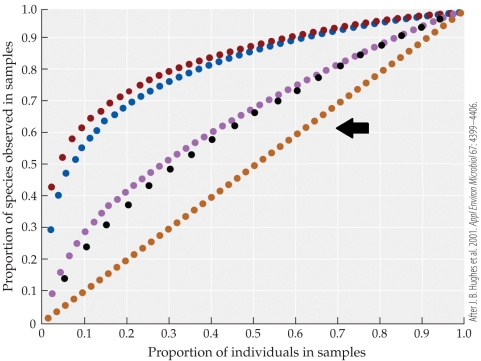 The figure is of a species accumulation curve, based on the studies of Hughes and colleagues. The orange line (indicated by the black arrow) represents the species accumulation curve for which community in the study?
A) Plants in a temperate forest in Michigan
B) Human oral bacteria
C) Costa Rica moth species
D) East Amazonian soil bacteria
Correct Answer:
Verified
Q56: Refer to the table and the figure.
Table
Q57: A group of interacting species that occur
Q58: Suppose you are wanting to study a
Q59: The lowest possible value of the Shannon
Q60: Suppose you wanted to determine whether you
Q62: Consider two tropical forests, each of which
Q63: The trophic facilitation phenomenon described by Hacker
Q64: Which scenario is a competitive network?
Scenario I:
Q65: Steelhead fish are predators of predatory insects,
Q66: The studies by Power and colleagues of
Unlock this Answer For Free Now!
View this answer and more for free by performing one of the following actions

Scan the QR code to install the App and get 2 free unlocks

Unlock quizzes for free by uploading documents