Refer to the figure.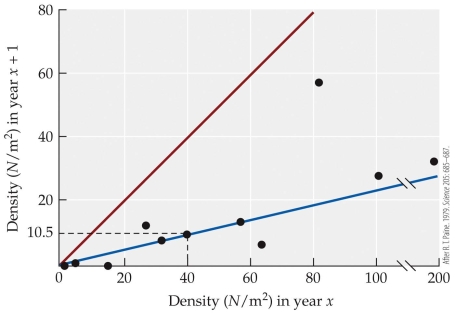 A population of sea palms in year 1 has a density of 80 N/m2. The predicted density expected in year 2 is _______ N/m2 which is _______ the exact replacement curve.
A) 60; below
B) 19; above
C) 19; below
D) 80; below
Correct Answer:
Verified
Q42: Which of the following findings from Connell's
Q43: Why is the barnacle Chthamalus found only
Q44: Which statement about Patterson's study of the
Q45: Based on Paine's studies, what has allowed
Q46: Suppose that a species of moss cannot
Q48: Brewer's study on pitcher plants showed that
Q49: What is not an explanation for coexistence
Q50: Two species are close competitors. If one
Q51: Two hypothetical species of plants have lived
Q52: Use inequalities generated by the Lotka-Volterra
Unlock this Answer For Free Now!
View this answer and more for free by performing one of the following actions

Scan the QR code to install the App and get 2 free unlocks

Unlock quizzes for free by uploading documents