Refer to the figure.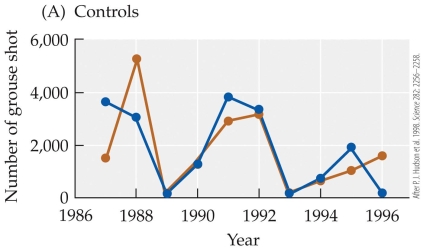
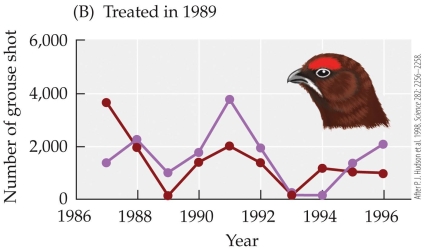
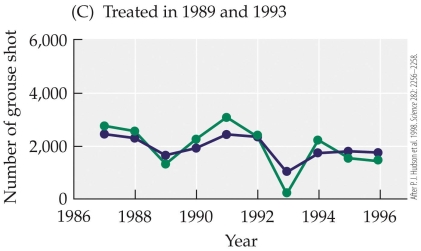 The figure shows results from a study by Hudson and colleagues on red grouse and their nematode parasite. The figures show the cycling of six red grouse populations subjected to three treatments: (A) two control populations, (B) two populations treated for nematode parasites in 1989, and (C) two populations treated for parasites in 1989 and 1993. Each of the six grouse populations is designated by a different color. These results show that removal of the parasite
A) caused host populations to collapse.
B) reduced the fluctuations of the grouse population.
C) increased the fluctuations of the grouse population.
D) halted population cycles in the red grouse.
Correct Answer:
Verified
Q28: Refer to the figure. Q29: Refer to the figure. Q30: Which of the following is most likely Q31: Kraaijeveld and colleagues performed studies with Drosophila Q32: The fungal parasite Cryphonectria parasitica is responsible Q34: In the context of host-parasite dynamics, a Q35: In the simple host-pathogen model, which Q36: According to the basic host-pathogen model, if Q37: According to the basic host-pathogen model, if Q38: In the simple host-pathogen model, which![]()
![]()
Unlock this Answer For Free Now!
View this answer and more for free by performing one of the following actions

Scan the QR code to install the App and get 2 free unlocks

Unlock quizzes for free by uploading documents