Refer to the figure.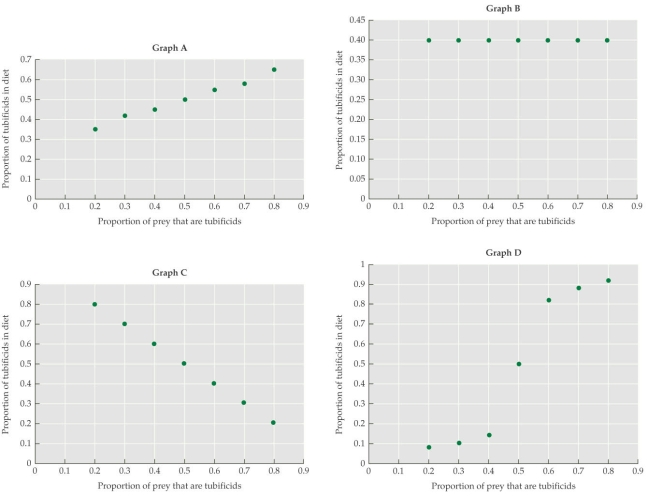 The graphs show different relationships between the proportion of prey that are tubificids and the proportion that are eaten by predators (guppies) . Based on research by Murdoch et al., which graph best represents the foraging habits of guppies?
A) Graph A
B) Graph B
C) Graph C
D) Graph D
Correct Answer:
Verified
Q52: Use the following simple predator-prey relationships to
Q53: Use the following simple predator-prey relationships to
Q54: Use the following simple predator-prey relationships to
Q55: Suppose you are studying the effect of
Q56: How does predation and herbivory differ from
Q58: Which statement about predators and herbivores is
Q59: Which statement about garter snakes and TTX
Q60: Which statement about the effects of herbivory
Q61: In the Lotka‒Volterra predator‒prey model, b represents
Q62: In the Lotka‒Volterra predator‒prey model, an increase
Unlock this Answer For Free Now!
View this answer and more for free by performing one of the following actions

Scan the QR code to install the App and get 2 free unlocks

Unlock quizzes for free by uploading documents