Refer to the figure.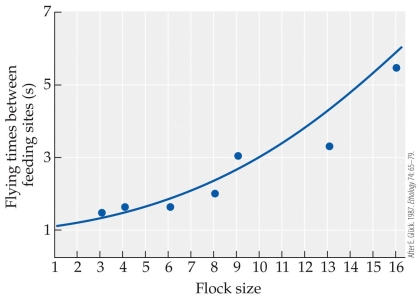 The figure shows data from a study on goldfinches that determined how foraging behavior changed with group size (referred to as "flock size") .
-Based on the figure, how many more or fewer seconds would a flock of 10 individuals spend flying between feeding sites compared to one individual foraging alone?
A) 1 second less
B) 1 second more
C) 2 seconds less
D) 2 seconds more
Correct Answer:
Verified
Q31: Refer to the figure. Q32: In a case where critical resources are Q33: In which mating system do males mate Q34: Suppose you are studying a species of Q35: In species where females provide the bulk Q37: Refer to the figure. Q38: Refer to the figure. Q39: Which scenario would likely result in the Q40: Refer to the table. Q41: Refer to the table. Unlock this Answer For Free Now! View this answer and more for free by performing one of the following actions Scan the QR code to install the App and get 2 free unlocks Unlock quizzes for free by uploading documents![]()
![]()
![]()
![]()
![]()

