Refer to the figure.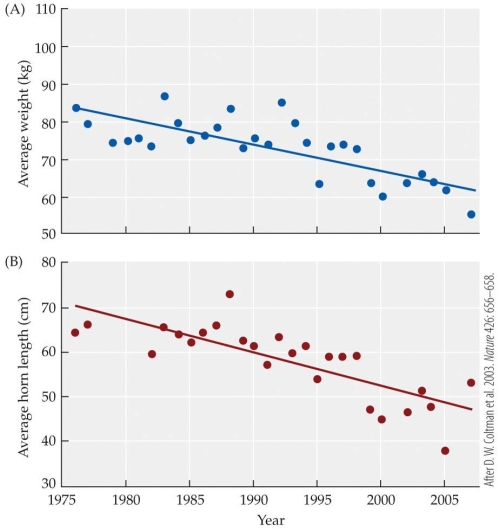
-The figure shows the changes associated with the overall size of bighorn sheep (top) , and the size of their horns (bottom) during the period between 1975 and 2005. In 2005 the sheep, on average, weighed approximately _______ than in 1976.
A) 10 kg less
B) 20 kg less
C) 10 kg more
D) 20 kg more
Correct Answer:
Verified
Q1: Trophy hunting in bighorn sheep has had
Q3: Refer to the figure. Q4: Which of the following has resulted from Q5: Tall people generally have tall parents, and Q6: Suppose a population of shorthorn cattle has Q7: If a population of monkeyflowers has 500 Q8: Suppose a population of worms is variable Q9: Grasshoppers and crickets share many similar characteristics Q10: Which of the following cannot be an Q11: Which process is least likely to be![]()
Unlock this Answer For Free Now!
View this answer and more for free by performing one of the following actions

Scan the QR code to install the App and get 2 free unlocks

Unlock quizzes for free by uploading documents