Refer to the figure.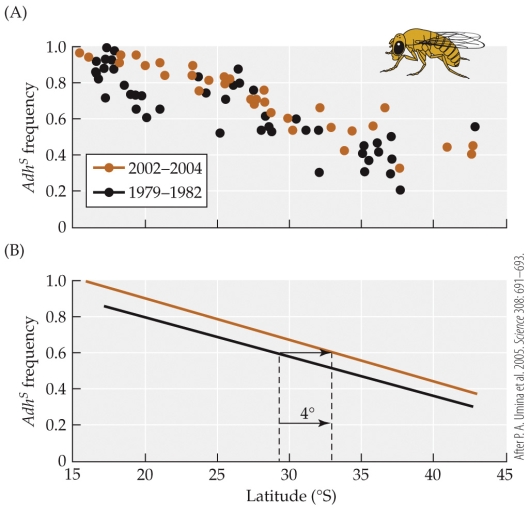
- The figure shows the frequency of the Adhs allele at different latitudes in Australia taken in 1979?1982, and again in 2002?2004. Consider 1981 as the baseline for the 1979?1982 data, and 2003 as the baseline for the 2002?2004 data. Based on these data, the cline is shifting _______ per year toward the _______.
A) 0.18°; north
B) 0.45°; north
C) 0.18°; south
D) 0.45°; south
Correct Answer:
Verified
Q24: What factor is important in minimizing the
Q25: The recovery of egg hatching rates in
Q26: Which pair of evolutionary processes can introduce
Q27: Carroll's studies showed that the beaks of
Q28: Refer to the figure. Q30: Which statement about adaptive evolution is true? Q31: Suppose the size of a bird's beak Q32: Which of the following is not a Q33: Suppose that several flies of a population Q34: Refer to the table.![]()
A)![]()
Unlock this Answer For Free Now!
View this answer and more for free by performing one of the following actions

Scan the QR code to install the App and get 2 free unlocks

Unlock quizzes for free by uploading documents