Refer to the figure.
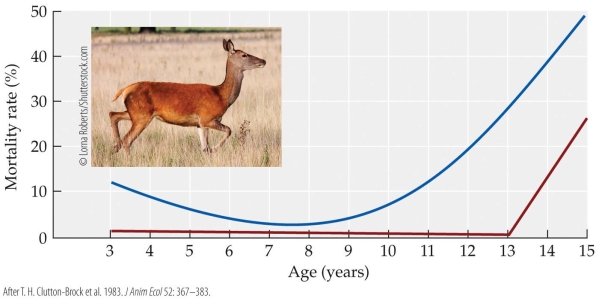 The figure shows the mortality rate for female red deer of different ages that reproduced (blue curve) or did not reproduce (red curve). Describe the patterns you see and suggest likely explanations for the general shapes of these two curves.
Correct Answer:
Verified
View Answer
Unlock this answer now
Get Access to more Verified Answers free of charge
Q45: As a habitat becomes fragmented, the population
Q46: Refer to the figure. Q47: Refer to the figure. Q48: Refer to the figure. Q49: Refer to the figure. Q51: Refer to the figure. Q52: Refer to the figure. Q53: Refer to the figure. Q54: If a population of Silene (a plant) Q55: Two tree species live in different environments Unlock this Answer For Free Now! View this answer and more for free by performing one of the following actions Scan the QR code to install the App and get 2 free unlocks Unlock quizzes for free by uploading documents
![]()
![]()
![]()
![]()
![]()
![]()
![]()

