Refer to the figure.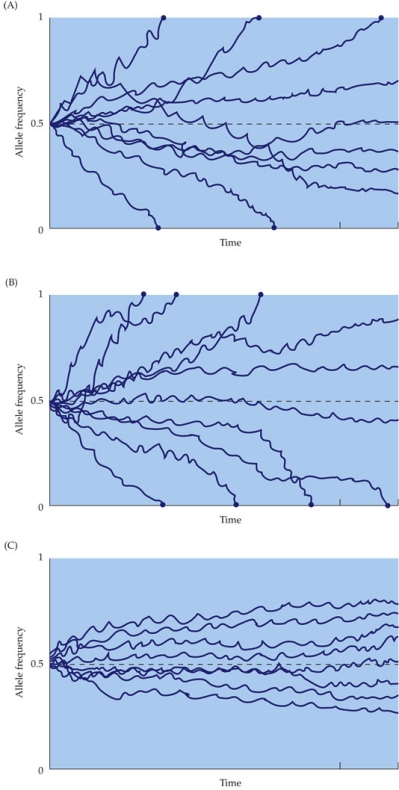 Simulations, in which it was assumed that the populations were subject to only genetic drift (no selection) , were performed using three different starting population sizes, and they were scored for the frequency of the B allele. All populations started with the frequency of 50% of the B allele. Each line represents a different replicate of the conditions. The three panels differ only in the population size. Which graph is of populations with the largest population size?
A) A
B) B
C) C
D) A and B had roughly equal population sizes, which were larger than those in panel C.
Correct Answer:
Verified
Q54: If a population of Silene (a plant)
Q55: Two tree species live in different environments
Q56: The mutation rate of a gene involved
Q57: In the 1890s, the biologist Hermon Bumpus
Q58: Genetic drift tends to _ genetic variation
Q60: Which evolutionary process is most likely to
Q61: Which statement about soapberry bug beaks is
Q62: You are studying two species of tree
Q63: Which of the following is not a
Q64: Refer to the table.![]()
Unlock this Answer For Free Now!
View this answer and more for free by performing one of the following actions

Scan the QR code to install the App and get 2 free unlocks

Unlock quizzes for free by uploading documents