Refer to the figure showing the results of Bjorkman and colleagues' studies of plant responses to different light levels. The plants were reared at three different levels of light intensity: high (red line) , medium (blue line) , and low (green line) . The acclimatized plants were then subjected to various light levels, and their ability to photosynthesize was measured.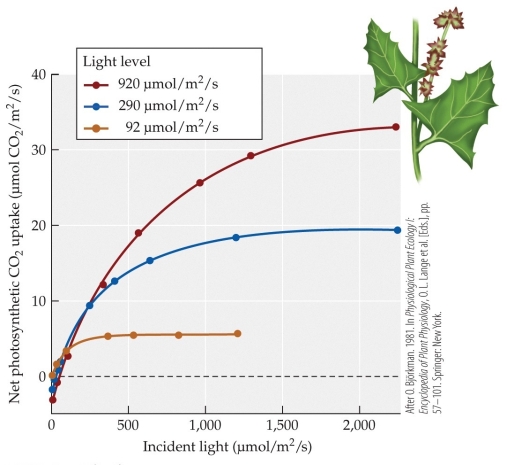 At the light intensity of 500 μmol/m2/s, the plants that are light-limited are those that are acclimatized to
A) high-intensity light only.
B) low-intensity light only.
C) both high-intensity and medium-intensity light.
D) both medium-intensity and low-intensity light.
Correct Answer:
Verified
Q13: Suppose that a small plant, through photosynthesis,
Q14: Suppose that a small plant, through photosynthesis,
Q15: What takes place during the second step
Q16: If photosynthesis had not developed on Earth,
Q17: Rubisco is important in both photosynthesis and
Q19: Refer to the figure showing the results
Q20: Refer to the figure. showing the results
Q21: As light increases, photosynthetic rates increase. The
Q22: Which of these is the best example
Q23: A plant living through a drought keeps
Unlock this Answer For Free Now!
View this answer and more for free by performing one of the following actions

Scan the QR code to install the App and get 2 free unlocks

Unlock quizzes for free by uploading documents