Refer to the figure showing acclimatization to two different growth temperature regimes from different populations of a shrub occurring in the Mojave Desert and in cool coastal zones in California. The two temperatures regimes used are representative of the two habitats.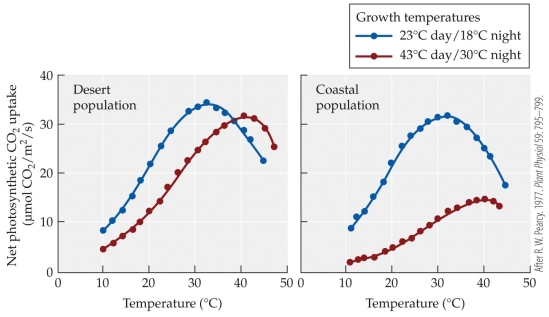 Of the four temperature curves in the two populations, which combination appears least able to acclimate to the given temperature regime?
A) Desert population at the 23°C day/18°C night regime
B) Desert population at the 43°C day/30°C night regime
C) Coastal population at the 23°C day/18°C night regime
D) Coastal population at the 43°C day/30°C night regime
Correct Answer:
Verified
Q19: Refer to the figure showing the results
Q20: Refer to the figure. showing the results
Q21: As light increases, photosynthetic rates increase. The
Q22: Which of these is the best example
Q23: A plant living through a drought keeps
Q25: The bacteria and archaea that inhabited the
Q26: In van Helmont's experiment measuring a growing
Q27: Refer to the table showing the oxygen
Q28: Refer to the figure showing the CO2
Q29: Which hypothesis about the benefits of photorespiration
Unlock this Answer For Free Now!
View this answer and more for free by performing one of the following actions

Scan the QR code to install the App and get 2 free unlocks

Unlock quizzes for free by uploading documents