Refer to the table Comparative Advantage and Trade. The table shows the number of laptops and phones that can be produced per unit of labor (the only input) in U.S and Brazil. Suppose that both countries have 100 million units of labor.
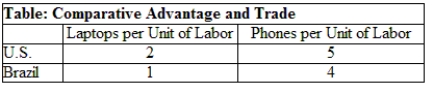 A. Draw the production possibility frontier for the United States, with the quantity of phones (in millions) on the x-axis and the quantity of laptops (in millions) on the y-axis.
B. Draw the production possibility frontier for Brazil with the quantity of phones (in millions) on the x-axis and the quantity of laptops (in millions) on the y-axis.
C. What is the opportunity cost of producing phones in the United States and Brazil?
D. What is the opportunity cost of producing laptops in the United States and Brazil?
E. Which country has the absolute advantage in producing laptops? Which country has the absolute advantage in producing phones? Explain your answer.
F. Which country has the comparative advantage in phones? Which country has the comparative advantage in laptops? Explain your answer.
Correct Answer:
Verified
View Answer
Unlock this answer now
Get Access to more Verified Answers free of charge
Q100: Refer to the figure Mutually Beneficial Trade
Q101: Refer to the figure Mutually Beneficial Trade
Q102: Refer to the figure Mutually Beneficial Trade
Q103: Refer to the figure Mutually Beneficial Trade
Q104: Refer to the figure Mutually Beneficial Trade
Q105: Refer to the figure Mutually Beneficial Trade
Q107: Refer to the table Comparative Advantage and
Q108: Suppose that the equilibrium exchange rate between
Q109: Consider the market for automobiles in the
Q110: Consider the market for automobiles in the
Unlock this Answer For Free Now!
View this answer and more for free by performing one of the following actions

Scan the QR code to install the App and get 2 free unlocks

Unlock quizzes for free by uploading documents