Use Figure: Demand for Gasoline. The figure shows the demand curve for gasoline in a small town that has only one provider, which therefore is a monopolist. The total revenue to the monopolist from selling three gallons is:
Figure: Demand for Gasoline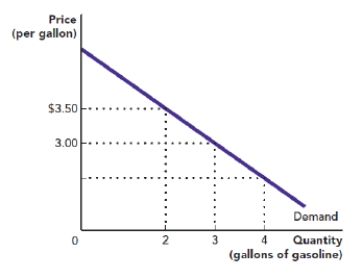
A) $7.
B) $9.
C) $10.
D) $11.
Correct Answer:
Verified
Q20: Which of the following statements is FALSE
Q21: For a monopolist, which one of the
Q22: Which one of the following statements is
Q23: Which one of the following statements is
Q24: Use Figure: Demand for Gasoline. The figure
Q26: A monopolist maximizes profit at the point
Q27: Suppose that the profit-maximizing price for a
Q28: Suppose that the total profit earned by
Q29: Suppose that a monopolist is operating at
Q30: Suppose that a monopolist is operating at
Unlock this Answer For Free Now!
View this answer and more for free by performing one of the following actions

Scan the QR code to install the App and get 2 free unlocks

Unlock quizzes for free by uploading documents