Use Figure: Payoff Matrix Shell & BP I. The figure shows the payoff matrix where the hypothetical daily profits of BP and Shell (in millions of dollars) depend on each other's decision about whether to lower prices. If each firm follows its dominant strategy, then BP's payoff would be _____, and Shell's payoff would be:
Figure: Payoff Matrix Shell & BP I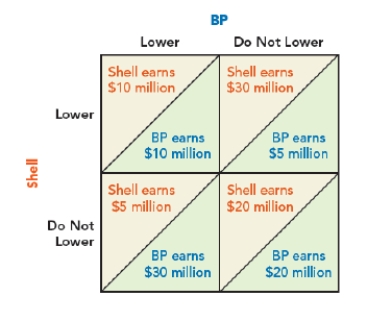
A) $10 million; $10 million.
B) $30 million; $30 million.
C) $20 million; $20 million.
D) $5 million; $30 million.
Correct Answer:
Verified
Q76: Suppose that a firm in a monopolistically
Q77: Suppose that a firm in a monopolistically
Q78: Which of the following statements is FALSE
Q79: Relative to a perfectly competitive market, a
Q80: Use Figure: Payoff Matrix Shell & BP
Q82: Use Figure: Payoff Matrix Alpha and Beta
Q83: Use Figure: Payoff Matrix Alpha and Beta
Q84: Use Figure: Payoff Matrix Shell and BP
Q85: Use Figure: Payoff Matrix Shell and BP
Q86: Use Figure: Payoff Matrix Alpha and Beta
Unlock this Answer For Free Now!
View this answer and more for free by performing one of the following actions

Scan the QR code to install the App and get 2 free unlocks

Unlock quizzes for free by uploading documents