Use Figure: The Market for Sandwiches II. What does the shaded area in this graph represent?
Figure: The Market for Sandwiches II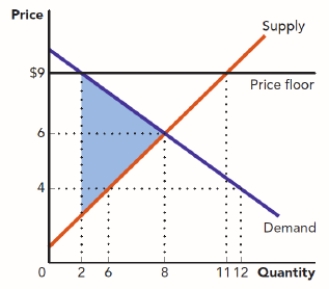
A) consumer surplus
B) deadweight loss
C) surplus
D) producer surplus
Correct Answer:
Verified
Q53: What is true about deadweight loss?
A) It
Q54: The consumer and producer surplus that is
Q55: The price in a market is currently
Q56: Use Figure: The Market for Sandwiches. How
Q57: Use Figure: The Market for Sandwiches II.
Q59: Use Figure: The Market for Aluminum. What
Q60: An increase in demand causes what changes
Q61: Why does an increase in demand cause
Q62: Why does the equilibrium quantity change when
Q63: How does the price and quantity change
Unlock this Answer For Free Now!
View this answer and more for free by performing one of the following actions

Scan the QR code to install the App and get 2 free unlocks

Unlock quizzes for free by uploading documents