Use the figure The Supply Curve II. The supply curve of a good has changed as shown in this graph in response to an increase in the price of another good. These two goods must be:
Figure: The Supply Curve II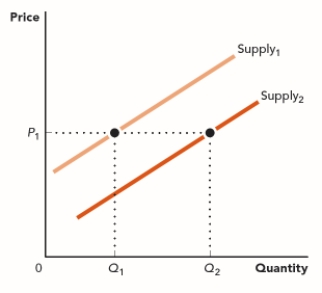
A) complements in production.
B) complements in consumption.
C) substitutes in production.
D) substitutes in consumption.
Correct Answer:
Verified
Q50: The inputs used to create two goods
Q51: Almonds can be used to produce almond
Q52: Good A and good B are complements
Q53: Soybeans can be used to produce meatless
Q54: When sawmills cut logs to produce lumber,
Q56: Good A and good B are complements
Q57: Good X and good Y are substitutes
Q58: Good R and good S are substitutes
Q59: Good L and good M are complements
Q60: When the price of honey decreased, the
Unlock this Answer For Free Now!
View this answer and more for free by performing one of the following actions

Scan the QR code to install the App and get 2 free unlocks

Unlock quizzes for free by uploading documents