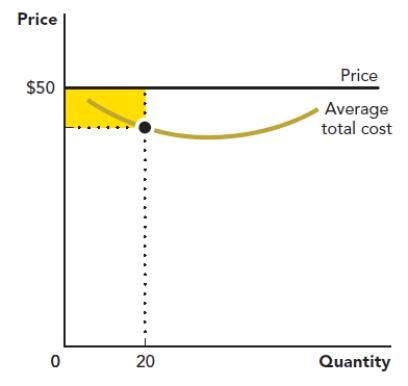
Use the figure Area of a Rectangle III. The rectangle in the accompanying graph represents the loss to a firm when it produces a quantity of 20 at a price of $500. Calculate the area of the rectangle.
Figure: Area of a Rectangle III
Correct Answer:
Verified
View Answer
Unlock this answer now
Get Access to more Verified Answers free of charge
Q17: Use the figure A Firm's Profit. What
Q18: Use the figure Area of a Triangle
Q19: Use Figure: Area of a Triangle I
Q20: Use the figure Area of a Triangle
Q21: Use the figure Area of a Rectangle
Q23: A _ is a graph that indicates
Q24: Jose has a chart showing the relationship
Q25: Eloise has data on the different categories
Q26: An economist wants to visualize whether there
Q27: A scatter diagram shows a falling pattern
Unlock this Answer For Free Now!
View this answer and more for free by performing one of the following actions

Scan the QR code to install the App and get 2 free unlocks

Unlock quizzes for free by uploading documents