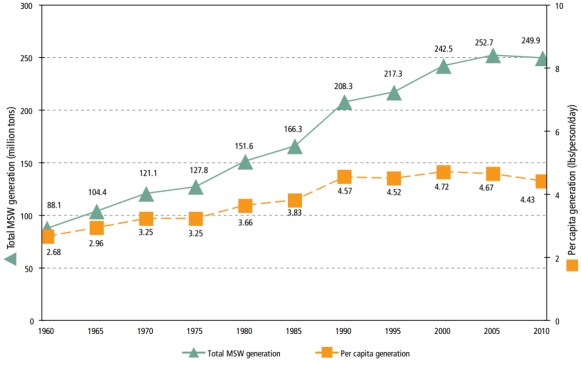
Refer to the figure below showing the US MSW generation rates from 1960 to 2010. Explain the trend in per capita waste generation from 1960-1990 compared to 1990-2010.
 (Source: http://www.epa.gov/osw/nonhaz/municipal/msw99.htm)
Correct Answer:
Verified
View Answer
Unlock this answer now
Get Access to more Verified Answers free of charge
Q21: Alpha emission is _ and gamma radiation
Q22: The US nuclear fuel share is approximately
Q23: The country with the highest nuclear fuel
Q24: The greatest amount of radioactivity in the
Q25: The measure of the extent to which
Q27: Describe how McDonald's partnership with the Environmental
Q28: Refer to the table below showing the
Q29: What is material substitution? Give a simple
Q30: Compare and contrast waste mining and dematerialization.
Q31: More than 90% of the radioisotopes on
Unlock this Answer For Free Now!
View this answer and more for free by performing one of the following actions

Scan the QR code to install the App and get 2 free unlocks

Unlock quizzes for free by uploading documents