Refer to the graph below showing the change in the number of individuals over time for a population limited by density dependence.
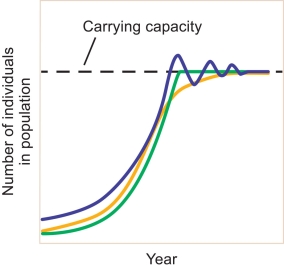
-Growth in the population is similar when the population is low and when it approaches its carrying capacity. Explain why the growth rate is similar under such different circumstances.
Correct Answer:
Verified
View Answer
Unlock this answer now
Get Access to more Verified Answers free of charge
Q24: Land use planning is the study of
Q25: Which of the following statements best describes
Q26: Explain how overpopulation can lead to an
Q27: Give a real life example of the
Q28: Give a real life example of the
Q30: Refer to the graph below showing the
Q31: Explain why maximum sustainable yields are difficult
Q32: The United Nations and the Ecological Society
Q33: Forest fires are typical during periods of
Q34: Why do we want to preserve the
Unlock this Answer For Free Now!
View this answer and more for free by performing one of the following actions

Scan the QR code to install the App and get 2 free unlocks

Unlock quizzes for free by uploading documents