Interpret the graph below.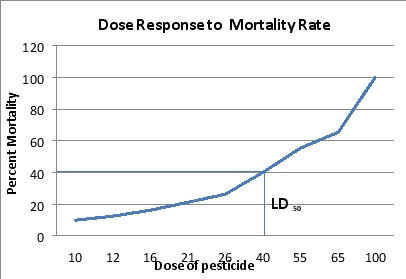
A) The graph shows that at a 100% dose of the pesticide the entire population will survive.
B) The graph shows that at the dose of 40%, 40% of the population dies.
C) The graph shows that at the dose of 40%, 100% of the population dies.
D) The graph shows the LD50 which represents the dose at which 40% of the population survives.
E) The graph shows the LD50 which represents the dose at which the population can handle the dose without any negative effects.
Correct Answer:
Verified
Q5: Which of the following statements about evolution
Q6: Suppose a farmer plants some crops but
Q7: Which of the following statements best explains
Q8: A biological _ is a group of
Q9: A homeowner is having problems with cockroaches.
Q11: The process by which traits become more
Q12: Some agricultural students conducted a study on
Q13: Which of the following statements is false?
A)
Q14: Which of the following statements about mutations
Q15: You are preparing a presentation on the
Unlock this Answer For Free Now!
View this answer and more for free by performing one of the following actions

Scan the QR code to install the App and get 2 free unlocks

Unlock quizzes for free by uploading documents