The graph below shows an expectations-augmented Phillips curve. If inflation is higher than expected, then unemployment is below the natural rate. If inflation is lower than expected, then unemployment is higher than the natural rate. For example, if inflation is expected to be 5% but actual inflation is 2%, then: 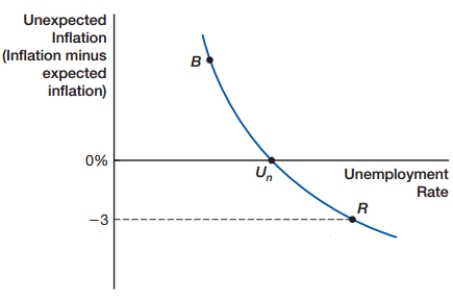
A) inflation will be at 3%.
B) the economy will be at the point Un.
C) the economy will be at the point
D) the economy will be at the point R.
Correct Answer:
Verified
Q55: Which of the following statements is consistent
Q56: The view that past correlations may not
Q57: The Lucas critique noted that:
A) policies are
Q58: How does the Lucas critique relate to
Q59: How is the unexpected inflation rate measured
Q61: How can the natural rate of unemployment
Q62: What happens on the expectations-augmented Phillips curve
Q63: When will the economy be at a
Q64: When will the economy be at a
Q65: According to the expectations-augmented Phillips curve, when
Unlock this Answer For Free Now!
View this answer and more for free by performing one of the following actions

Scan the QR code to install the App and get 2 free unlocks

Unlock quizzes for free by uploading documents