(Figure: ASAD0) In the figure, in the 1930s the economy moved from point 1 to 2. What does point 2 suggest?
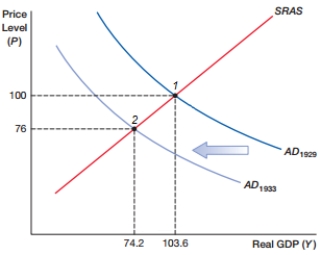
A) economic growth
B) inflation
C) a recession
D) disinflation
Correct Answer:
Verified
Q2: The graph of the aggregate supply and
Q3: A sudden and large shift in an
Q4: Aggregate demand is the:
A) total demand for
Q5: When aggregate demand declines, an economy will
Q6: If Econia's aggregate demand falls, the price
Q8: (Figure: ASAD0) In the figure, the price
Q9: The slope of the long-run aggregate supply
Q10: (Figure: Natural Rate) What does the figure
Q11: In the long run, total national output:
A)
Q12: Why does the amount of national output
Unlock this Answer For Free Now!
View this answer and more for free by performing one of the following actions

Scan the QR code to install the App and get 2 free unlocks

Unlock quizzes for free by uploading documents