(Figure: Curve) What does the figure represent?
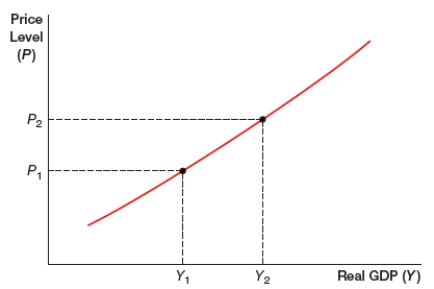
A) long-run aggregate demand curve
B) short-run aggregate demand curve
C) long-run aggregate supply curve
D) short-run aggregate supply curve
Correct Answer:
Verified
Q17: Which of the following does NOT describe
Q18: (Figure: LRAS0) In the figure, the economy
Q19: (Figure: LRAS0) In the figure, what would
Q20: When business cycles are analyzed, what part
Q21: What is the difference between the short-run
Q23: Which of the following is NOT a
Q24: In the short run, when the average
Q25: In the short run, what type of
Q26: A study of the frequency of price
Q27: What change occurs in the aggregate supply
Unlock this Answer For Free Now!
View this answer and more for free by performing one of the following actions

Scan the QR code to install the App and get 2 free unlocks

Unlock quizzes for free by uploading documents