(Figure: SRASA) In the figure, what will NOT cause the shift from SRAS1 to SRAS2?
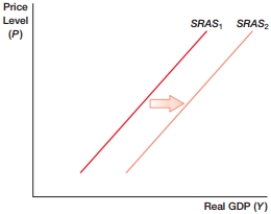
A) lower wages
B) lower raw material costs
C) lower productivity levels
D) All of the above could cause the shift.
Correct Answer:
Verified
Q33: (Figure: SRAS0) In the figure, what will
Q34: (Figure: SRAS0) In the figure, what will
Q35: (Figure: SRAS0) In the figure, what will
Q36: (Figure: SRASA) In the figure, what will
Q37: (Figure: SRASA) In the figure, what will
Q39: The Martinez household has $40,000 in savings
Q40: (Figure: Curve 0) What does the figure
Q41: In the context of aggregate demand, the
Q42: In the context of aggregate demand, the
Q43: Which of the following is a difference
Unlock this Answer For Free Now!
View this answer and more for free by performing one of the following actions

Scan the QR code to install the App and get 2 free unlocks

Unlock quizzes for free by uploading documents