(Figure: Decrease in Aggregate Demand) The figure shows a shift of aggregate demand curve to the left due to one or more of the following sources, EXCEPT:
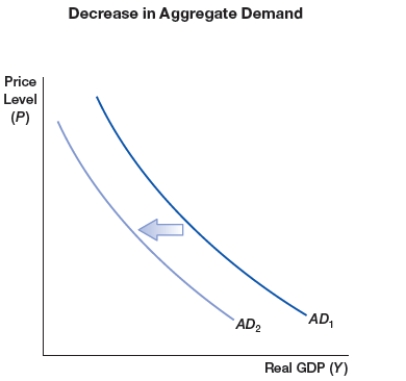
A) increase in taxes
B) decrease in money supply
C) decrease in government spending
D) optimistic expectations
Correct Answer:
Verified
Q42: In the context of aggregate demand, the
Q43: Which of the following is a difference
Q44: According to the net exports effect, along
Q45: Which of the following is NOT a
Q46: A shift in an aggregate demand curve
Q48: (Figure: Increase in Aggregate Demand) The figure
Q49: The aggregate demand curve has a slope
Q50: Which of the following is NOT a
Q51: Which of the following would NOT cause
Q52: Which of the following would NOT cause
Unlock this Answer For Free Now!
View this answer and more for free by performing one of the following actions

Scan the QR code to install the App and get 2 free unlocks

Unlock quizzes for free by uploading documents